Flotr2 JS
This example creates a chart using HTML5 and the Flotr2 JS chart engine (http://www.humblesoftware.com/flotr2/).
Repository files
PDF files


HTML input
<html>
<head>
<style type="text/css">
body {
margin: 0px;
padding: 0px;
}
#container {
width : 15cm;
height: 15cm;
margin: 8px auto;
}
</style>
</head>
<body>
<div id="container" style=""></div>
<!--[if IE]>
<script type="text/javascript" src="path/to/flashcanvas.js"></script>
<![endif]-->
<script type="text/javascript" src="flotr2.min.js"></script>
<script type="text/javascript">
(function () {
var
container = document.getElementById('container'),
data = [],
graph, i;
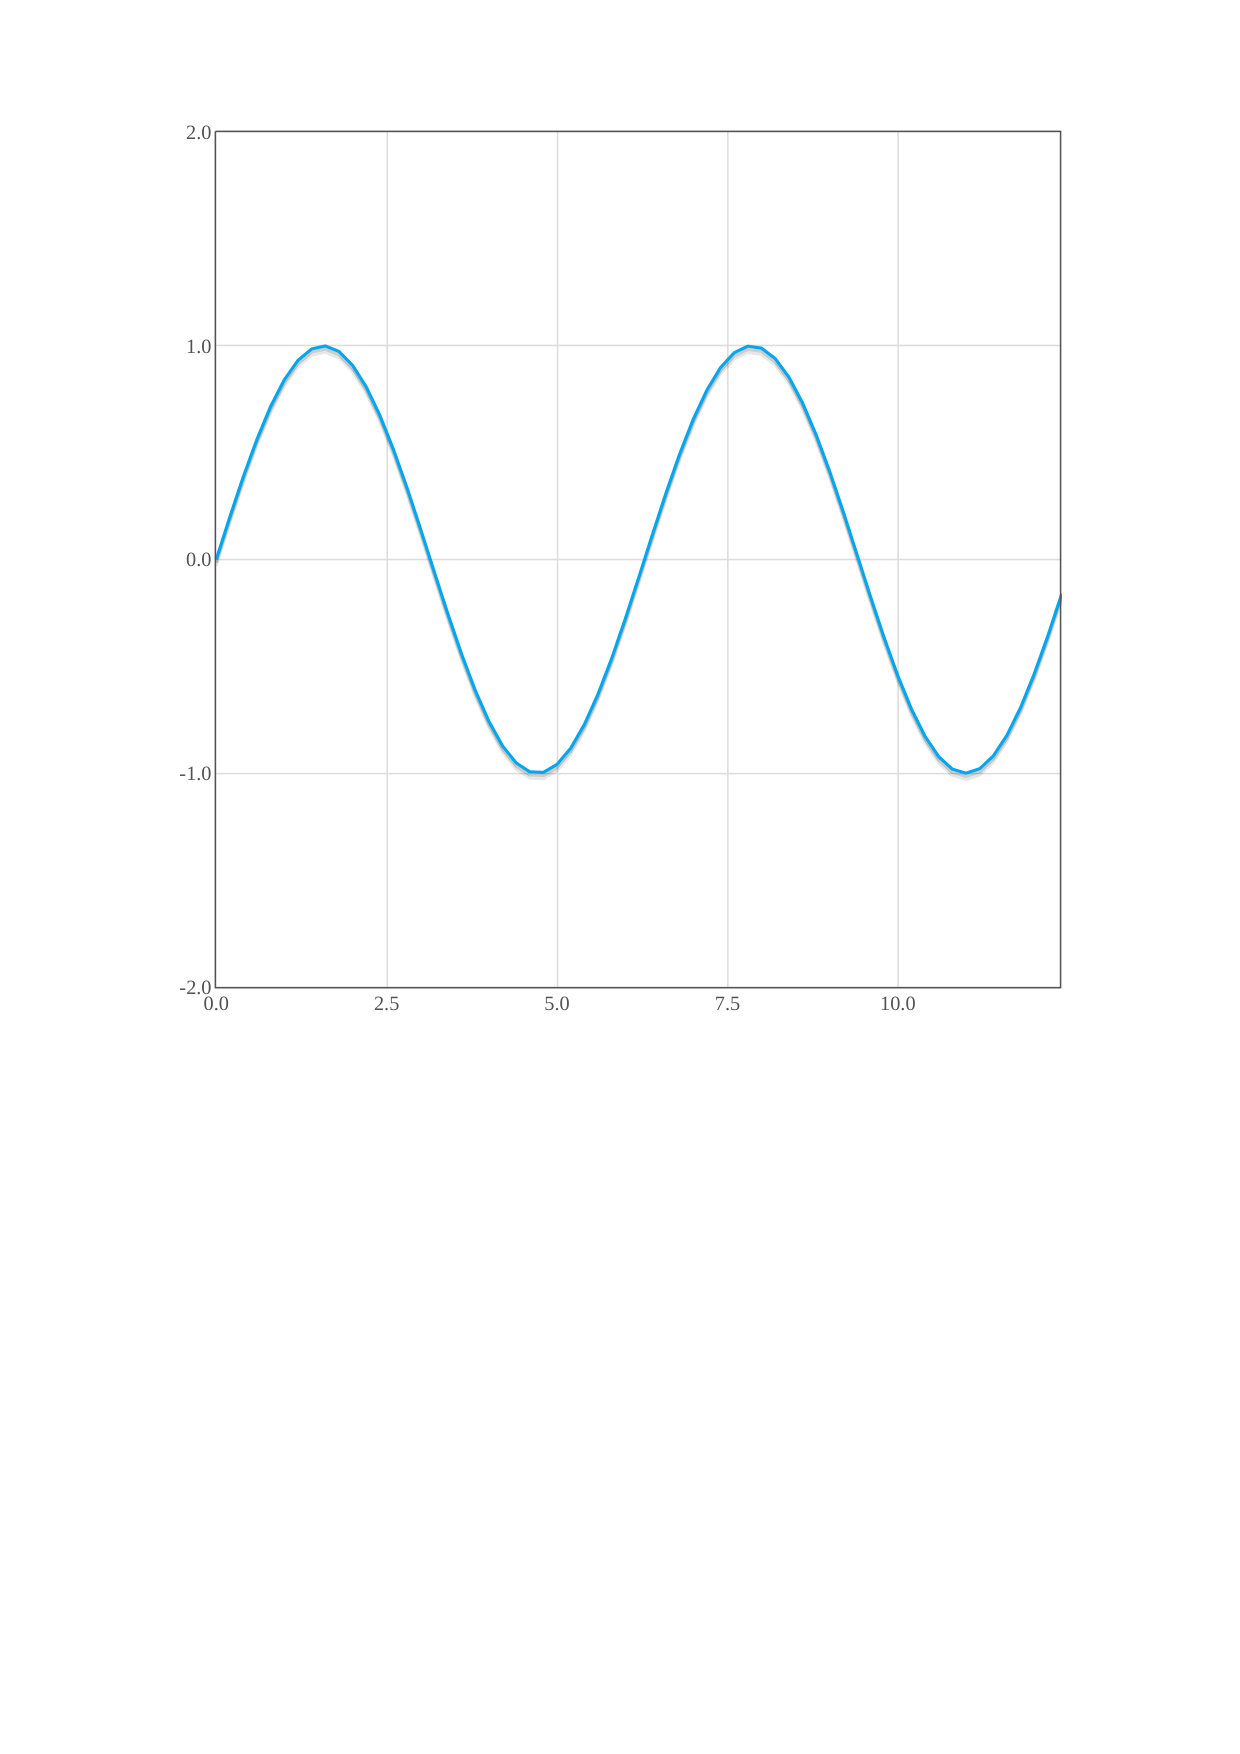
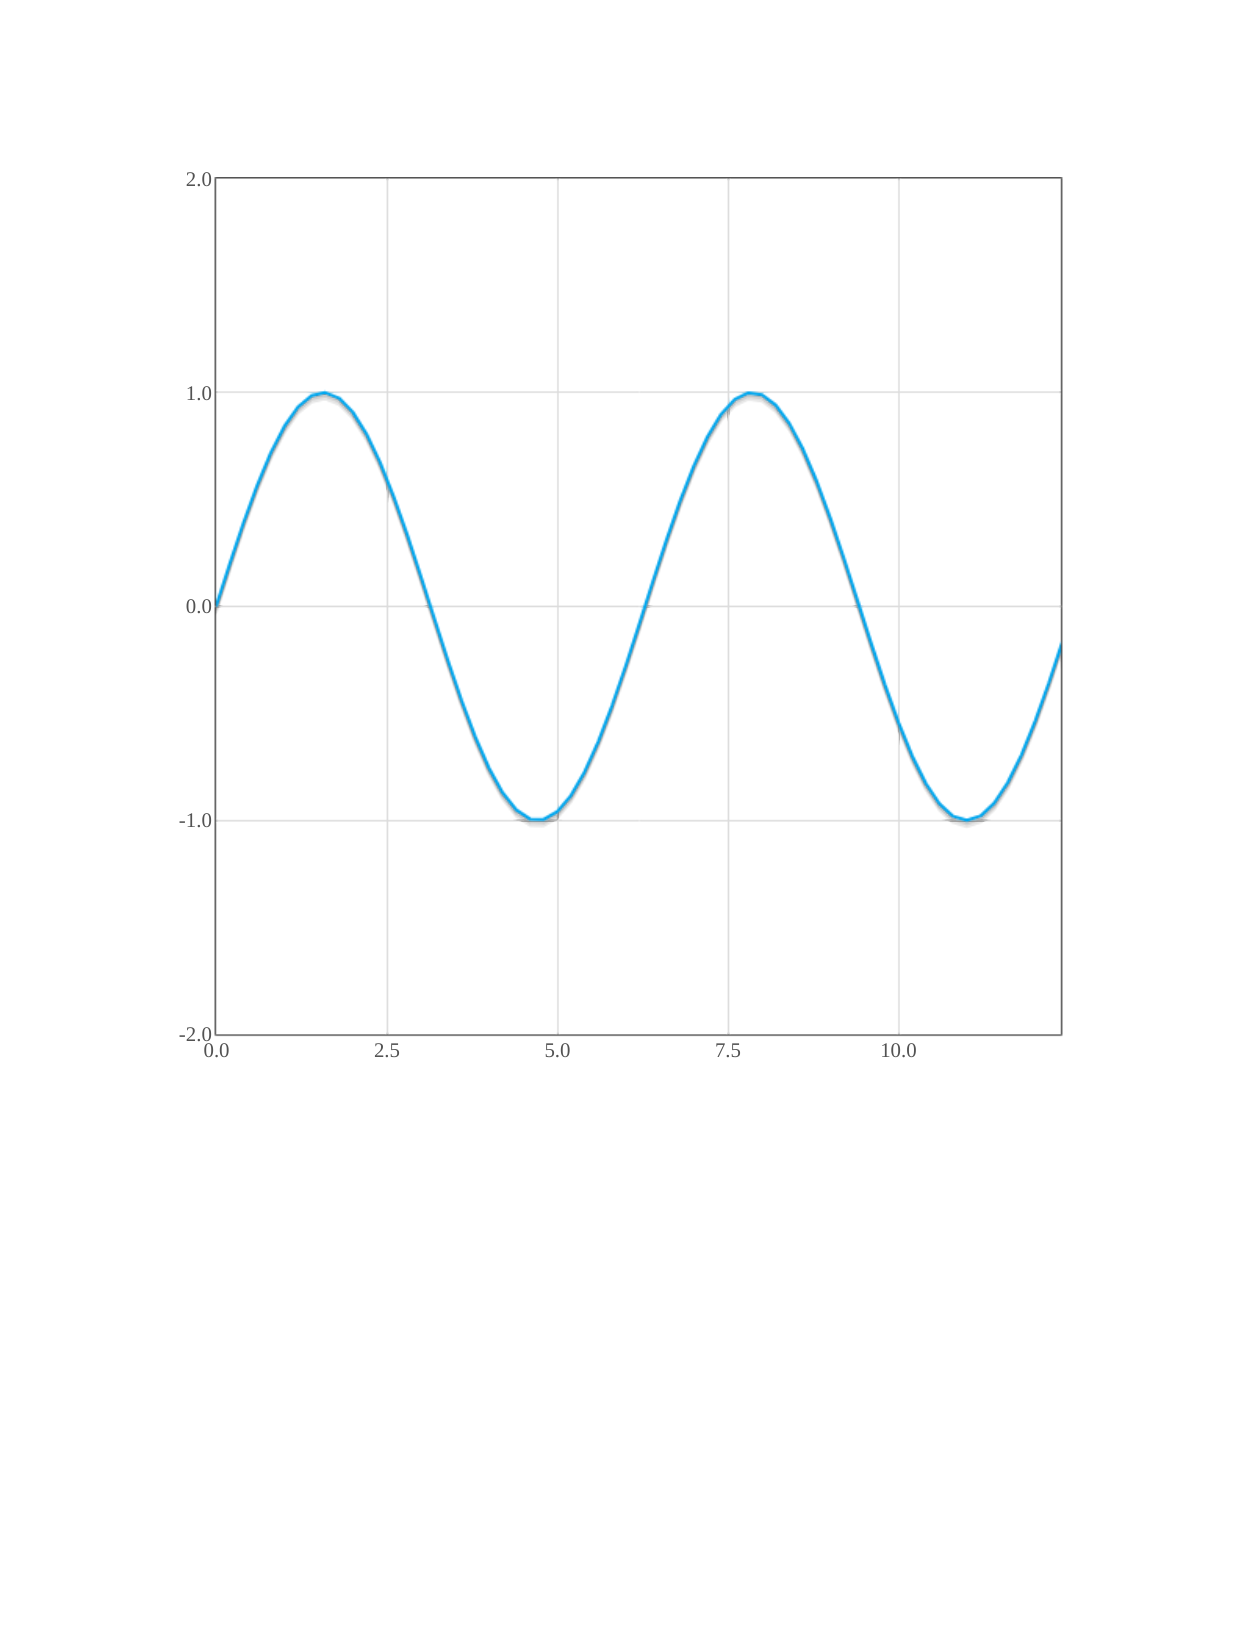
// Sample the sine function
for (i = 0; i < 4 * Math.PI; i += 0.2) {
data.push([i, Math.sin(i)]);
}
// Draw Graph
graph = Flotr.draw(container, [ data ], {
yaxis : {
max : 2,
min : -2
}
});
})();
</script>
</body>
</html>